
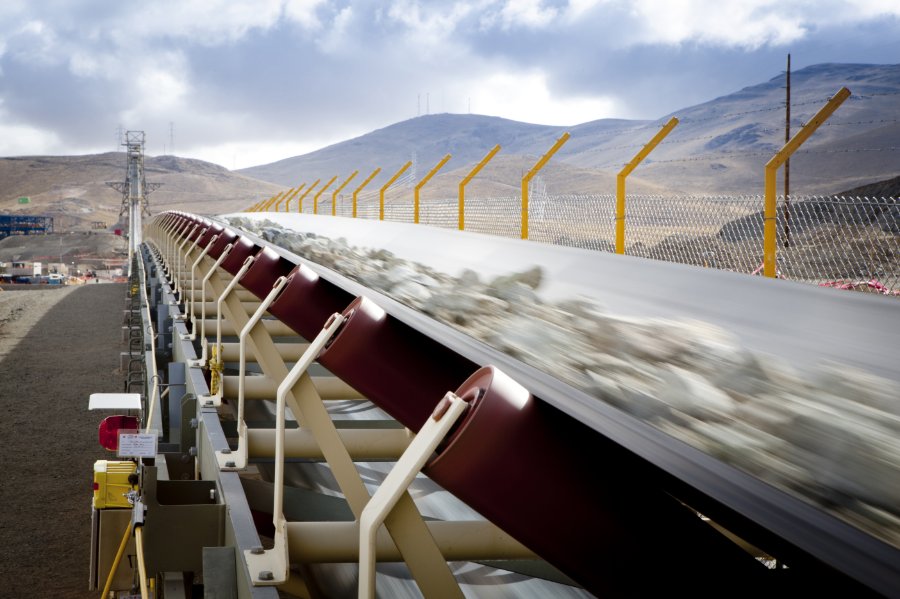
As mine owners sharpen their focus on reducing carbon emissions, optimizing the design of overland conveyor systems can play a key role in success. How can these systems best be configured to meet both operational and economic requirements, as well as environmental performance expectations?
The Carbon Comparator, a new tool developed by Bechtel is helping to answer that question.
The Carbon Comparator enables us to perform a detailed assessment of various design criteria. And the results might be a surprise to some operators in the industry.
What is the Carbon Comparator tool?
Having data to support decision-making on carbon-reduction programs has always been a challenge. The Carbon Comparator allows us to generate estimates of embodied and operational greenhouse gas (GHG) emissions for multiple design scenarios, which can then be used as part of our multi-criteria assessment for optimizing project-specific designs. Through visualization of critical data for cost and carbon comparisons, the tool allows our customers to select the best technology and equipment options.
The challenge:
As designers of mining facilities, we play a significant role in defining a mine’s overall GHG emissions performance. This demands greater awareness of all the GHG emissions sources, including Scope 3 emissions, which will make up an increasing fraction of emissions as power generation sources shift to renewable energy.
Traditionally overland conveyors are designed to operate “as fast as practical,” achieving benefits of reduced tensions, width, mechanical equipment masses, structural steel, and concrete quantities. Higher belt speeds reduce capital cost and improve project economics. However, operating at higher speeds also introduces operating costs through increased energy losses and wear rates.
Using the Carbon Comparator tool, we studied the lifecycle emissions from an overland conveyor under a range of design parameters to demonstrate how the design criteria and design decisions impact GHG emissions and project economics. For this assessment we developed a study project with a single overland conveyor located in the Pilbara region of Western Australia, using inputs based on our typical project execution and operational strategies for a project in this region.
The findings:
Eight conveyor configurations were developed over a broad range of belt speeds to allow evaluation of designs outside of the typical design norms as shown in Table 1. As expected, capital costs increase with belt width. Similarly, embodied carbon increases with belt width, albeit at greater sensitivity.
Table 1 Capitol Costs and Embodied Carbon
|
Option |
Capital Cost Index |
Embodied Emissions (t CO2e) |
Embodied Carbon Index (Relative to Base) |
|
Option 1 |
1.16 |
1,444 |
1.25 |
|
Option 2 |
1.05 |
1,316 |
1.14 |
|
Option 3 |
1.03 |
1,264 |
1.09 |
|
Option 4 |
1.04 |
1,270 |
1.10 |
|
Option 5 |
1.01 |
1,283 |
1.11 |
|
Option 6 |
1.00 |
1,157 |
1.00 |
|
Option 7 |
0.98 |
1,113 |
0.96 |
|
Option 8 |
0.94 |
1,141 |
-1% |
The current “as fast as practical” design paradigm holds for capital costs and embodied emissions. However, it may result in a sub-optimal solution over the operational life of the system.
To evaluate the lifecycle impacts, we ran our model using a 20-year operational life, considered three different power supply options, and evaluated two carbon pricing models. The total emissions and Net Present Cost (NPC) for each of the options are summarised in the following figures and tables.
Table 2 Life Cycle Emissions
|
Option |
Life Cycle Emissions (kt CO2e) |
Life Cycle Emissions Index (Relative to Base) |
||||
|
|
CCGT |
Behind the meter (unfirmed) solar |
Green Power Purchase AgreementPPA |
Combined cycle gas turbine CCGT |
Behind the meter (unfirmed) solar |
Green PPA |
|
Option 1 |
48.5 |
35.8 |
2.5 |
0.84 |
0.62 |
0.04 |
|
Option 2 |
50.1 |
37.1 |
2.8 |
0.87 |
0.64 |
0.05 |
|
Option 3 |
51.3 |
38.0 |
2.9 |
0.89 |
0.66 |
0.05 |
|
Option 4 |
52.7 |
38.9 |
2.8 |
0.91 |
0.67 |
0.05 |
|
Option 5 |
52.5 |
39.1 |
3.7 |
0.91 |
0.68 |
0.06 |
|
Option 6 |
57.7 |
42.7 |
3.4 |
1.00 |
0.74 |
0.06 |
|
Option 7 |
63.8 |
47.8 |
5.6 |
1.11 |
0.83 |
0.10 |
|
Option 8 |
65.4 |
49.5 |
7.9 |
1.13 |
0.86 |
0.14 |
Scope 3 emissions from each of the options varied, with higher belt speeds resulting in greater proportions of Scope 3 emissions. The total Scope 3 emissions for Options 1 through 4 were approximately 5%, increasing up to 11% for Option 8. The increase in Scope 3 emissions is driven by the reduced mechanical equipment life and associated increase in site labour. The most significant contributor to the increase was the conveyor belt.
The result:
For this configuration over the 20-year life with power supplied by CCGT, the operational emissions were approximately 50 times the embodied emissions. Reducing the belt speed and increasing the belt width reduced lifecycle emissions by approximately 10%, at a marginal abatement cost of between -$144 to -$171 per t CO2e.
Table 3 Net Present Cost Index
|
Option |
US$0 Carbon Price |
US$100 Carbon Price |
||||
|
|
CCGT |
Behind the meter (unfirmed) solar |
Green PPA |
CCGT |
Behind the meter (unfirmed) solar |
Green PPA |
|
Option 1 |
0.96 |
1.03 |
0.99 |
1.19 |
1.20 |
1.00 |
|
Option 2 |
0.95 |
1.02 |
0.98 |
1.19 |
1.20 |
0.99 |
|
Option 3 |
0.95 |
1.02 |
0.98 |
1.19 |
1.20 |
0.99 |
|
Option 4 |
0.95 |
1.02 |
0.98 |
1.20 |
1.21 |
0.99 |
|
Option 5 |
1.01 |
1.08 |
1.04 |
1.26 |
1.27 |
1.06 |
|
Option 6 |
1.00 |
1.08 |
1.03 |
1.27 |
1.28 |
1.05 |
|
Option 7 |
1.20 |
1.27 |
1.23 |
1.50 |
1.50 |
1.25 |
|
Option 8 |
1.37 |
1.46 |
1.41 |
1.68 |
1.69 |
1.44 |
Figure 1 Net Present Cost Index
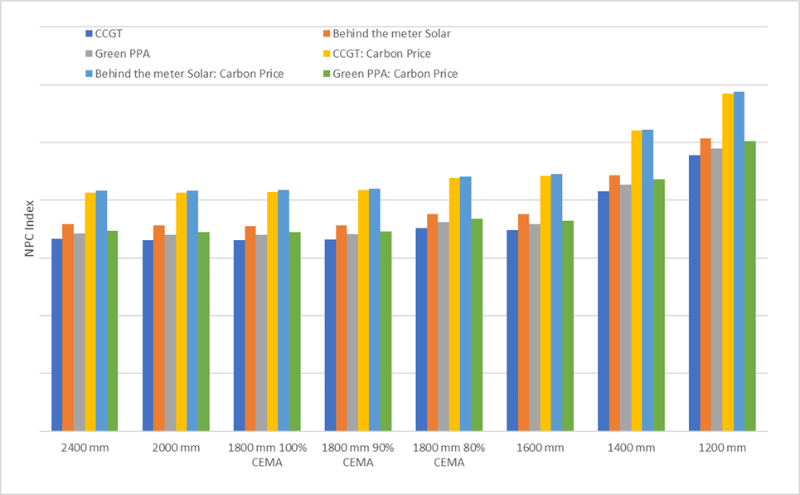
From the above it is clear that the faster-is-better design paradigm needs to be challenged given the need to achieve decarbonisation across the whole value chain. Using a structured approach during the design phase with consideration of the lifecycle emissions can result in facility designs that reduce operational emissions and improve the overall project economics.